Problem-Solution Opening: Navigating the Maze of Z-Tests and T-Tests
For those delving into statistical analysis, navigating the intricate landscape of hypothesis tests can be daunting. The two most commonly used tests in this realm are the Z-test and the T-test, each serving distinct purposes and scenarios. Misunderstanding these tests can lead to incorrect conclusions and wasted time. This guide aims to demystify these tests, providing you with clear, actionable steps and practical solutions to ensure you select the right tool for your data analysis. We’ll dissect when to use a Z-test versus a T-test, walking you through the specifics with relatable examples and best practices. By the end, you’ll be equipped to choose the appropriate test for your needs confidently.
Quick Reference
Quick Reference
- Immediate action item: Determine your sample size first; if it’s large (n > 30), consider a Z-test.
- Essential tip: For small samples (n < 30), the T-test is more appropriate, especially when population variance is unknown.
- Common mistake to avoid: Using a Z-test for small samples or ignoring the requirement for known population standard deviation.
Detailed How-To: The Z-Test Explained
The Z-test is a powerful statistical tool used when the sample size is large, typically when n > 30. It assumes that the distribution of the population is normally distributed. Here’s how you can effectively apply the Z-test:
Step 1: Confirm Assumptions
Begin by ensuring your data meets the Z-test criteria. Confirm that your sample size is sufficiently large and that the population variance is known. For instance, if you’re comparing the average heights of adult males from a large population where the standard deviation is known, a Z-test is appropriate.
Step 2: Formula Application
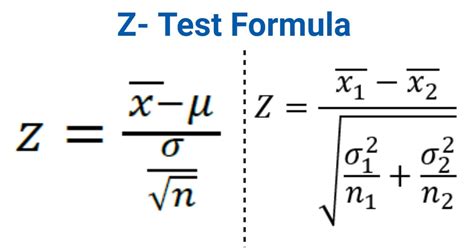
Use the Z-test formula: Z = (X̄ - μ) / (σ / √n) Where:
- X̄ is the sample mean
- μ is the population mean
- σ is the population standard deviation
- n is the sample size
Here’s a practical example: suppose you’re comparing the average annual income of a sample of 500 adults in your city. You know the population’s standard deviation for income is 15,000. Your sample mean income is 60,000. Using the formula, you can calculate the Z-value and proceed to determine whether there is a significant difference from the population mean.
Step 3: Critical Value and Decision Making
Find the critical value from the Z-table corresponding to your significance level (commonly α = 0.05). Compare your calculated Z-value with the critical value. If your Z-value exceeds the critical value, reject the null hypothesis.
Detailed How-To: The T-Test Explained
The T-test is crucial when dealing with small sample sizes (typically n < 30), especially when the population standard deviation is unknown. Here’s how to navigate the T-test effectively:
Step 1: Validate Assumptions
Ensure your data is suited for a T-test. Confirm that your sample size is small, and you don’t know the population standard deviation. For example, if you’re analyzing test scores from a small class of 20 students and haven’t been given the population standard deviation, a T-test is your go-to.
Step 2: Formula Application
The T-test formula is: T = (X̄ - μ) / (s / √n) Where:
- X̄ is the sample mean
- μ is the population mean
- s is the sample standard deviation
- n is the sample size
For instance, if you’re comparing the average scores of a small group of 15 students with a sample mean score of 85 and a sample standard deviation of 10, apply this formula to calculate the T-value.
Step 3: Critical Value and Decision Making
Locate the critical T-value from the T-distribution table for your desired significance level and degrees of freedom (df = n - 1). If your calculated T-value exceeds the critical T-value, reject the null hypothesis.
Practical FAQ
When should I use a Z-test instead of a T-test?
You should opt for a Z-test when dealing with large sample sizes (n > 30) where the population standard deviation is known. The Z-test is more accurate for large samples because it can better handle the assumptions of a normal distribution.
What happens if I incorrectly use a Z-test for small sample sizes?
If you incorrectly use a Z-test for small samples, your results may be inaccurate because the Z-test assumes a larger sample size and normally distributed population variance. The T-test is more appropriate for small samples, as it accounts for the increased variability that comes with smaller sample sizes.
How do I determine the significance level?
The significance level, commonly denoted by α, is typically set at 0.05, which corresponds to a 95% confidence level. However, depending on your study’s context, you might choose a different significance level, such as 0.01 for more stringent tests or 0.10 for less stringent tests.
This guide has provided an in-depth understanding of when to use the Z-test versus the T-test, complete with actionable advice and real-world examples to help you avoid common pitfalls. Armed with this knowledge, you’re now well-prepared to choose the correct statistical test for your data analysis needs.