Joint relative frequency is a fundamental concept in data analysis, providing a valuable lens through which we can interpret the relationship between two categorical variables. Understanding joint relative frequency can unlock deeper insights and make your data more actionable. This guide will walk you through everything you need to know, offering step-by-step guidance, practical examples, and expert tips to maximize the value of this statistical tool.
Problem-Solution Opening Addressing User Needs
Imagine you’re trying to understand the interaction between two categorical variables like customer satisfaction and product type in your business. Traditional analysis might give you individual insights, but what if you need a more nuanced understanding of how these variables relate to each other? This is where joint relative frequency becomes invaluable. It allows you to see how often particular combinations occur within your dataset, thereby uncovering patterns that could be critical for strategic decisions.
However, the traditional approach might be daunting. You might find it hard to compute, interpret, and ultimately apply these insights to your data analysis. Our guide aims to demystify joint relative frequency by breaking it down into manageable, actionable steps. By the end, you’ll not only understand what joint relative frequency means but also how to use it effectively to glean actionable insights from your data.
Quick Reference
Quick Reference
- Immediate action item: Create a contingency table to display the joint relative frequencies of your categorical variables.
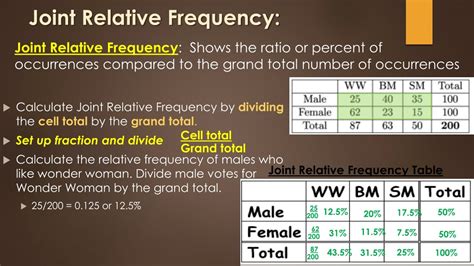
- Essential tip: To calculate joint relative frequency, divide the joint frequency of a particular combination by the total number of observations.
- Common mistake to avoid: Confusing joint relative frequency with marginal relative frequency; ensure you account for the specific combination of categories rather than the individual categories.
Understanding Joint Relative Frequency
Joint relative frequency refers to the proportion of times that two categorical variables occur together in a dataset. Essentially, it tells you how often a specific combination of categories from two variables appears within the dataset, relative to the total number of observations. To visualize this, let’s dive into the step-by-step process of calculating and interpreting joint relative frequency.
Step-by-Step Calculation of Joint Relative Frequency
Here’s how you can calculate joint relative frequency:
- Identify the categories: First, list all the possible categories for your two variables. For instance, if you’re analyzing customer satisfaction (satisfied, dissatisfied) and product type (A, B, C), list all the combinations of these categories.
- Create a contingency table: Construct a table that cross-tabulates the two variables. Each cell in the table represents the joint frequency of a particular combination. Here’s a sample table:
- Calculate joint relative frequency: To find the joint relative frequency, divide the joint frequency of a particular cell by the total number of observations. For example, the joint relative frequency for product A and satisfied customers is calculated as follows:
| Product Type | Satisfied | Dissatisfied | Total |
|---|---|---|---|
| A | 20 | 10 | 30 |
| B | 15 | 18 | 33 |
| C | 25 | 22 | 47 |
| Total | 60 | 50 | 110 |
Joint relative frequency = (joint frequency) / (total number of observations)
For product A and satisfied customers:
Joint relative frequency = 20 / 110 = 0.1818
Interpreting Joint Relative Frequency
Understanding the results of your joint relative frequency calculations can provide profound insights into the relationship between your variables. Here’s how to interpret your findings:
- Identify patterns: Look for cells with significantly higher joint relative frequencies which may indicate a strong relationship between the categories. For example, a higher joint relative frequency for product A and satisfied customers suggests a strong association between these two categories.
- Compare across categories: Compare the joint relative frequencies across different categories to see where the most significant patterns occur.
- Look for anomalies: If certain combinations have unexpectedly low joint relative frequencies, it may signal something noteworthy about your data that requires further investigation.
Advanced Techniques for Joint Relative Frequency Analysis
Once you’re comfortable with the basics of joint relative frequency, you can start exploring more advanced techniques to deepen your analysis:
Chi-Square Test for Independence
To determine if there is a significant association between the two categorical variables, you can use the chi-square test for independence. Here’s how:
- Formulate hypotheses: Null hypothesis (H0): The two variables are independent. Alternative hypothesis (H1): The two variables are dependent.
- Calculate expected frequencies: For each cell in the contingency table, calculate the expected frequency assuming independence.
- Compute chi-square statistic: Use the formula:
- Determine the critical value: Find the critical value from the chi-square distribution table based on the degrees of freedom (df = (number of rows - 1) * (number of columns - 1)) and the desired significance level (usually 0.05).
- Compare and conclude: If the computed chi-square statistic is greater than the critical value, reject the null hypothesis, indicating a significant association between the variables.
Chi-square statistic = Σ[(observed frequency - expected frequency)² / expected frequency]
Visualizing Joint Relative Frequency
Visual aids can make understanding joint relative frequency much easier. Here are some effective visualization techniques:
- Heatmaps: Use a heatmap to visually represent joint relative frequencies. Darker shades indicate higher joint relative frequencies, providing a quick overview of which combinations are most common.
- Bar charts: Create bar charts for each category of one variable, with bars showing joint relative frequencies for each category of the other variable. This helps in visually comparing relationships.
- Stacked bar charts: Use stacked bar charts to show the composition of joint relative frequencies within each category of one variable, providing a detailed view of the distribution.
Practical FAQ
How do I decide when to use joint relative frequency analysis?
Joint relative frequency analysis is particularly useful when you need to understand the relationship between two categorical variables. Use it when you suspect that the occurrence of one category might influence the occurrence of another. For example, you might use it to examine whether product type impacts customer satisfaction levels.
It’s a great tool for exploratory data analysis, particularly in marketing, survey analysis, and any field where you want to uncover underlying patterns in categorical data.
What are common pitfalls to avoid when calculating joint relative frequency?
One common pitfall is failing to correctly count joint frequencies or misinterpreting the data. Ensure you accurately count each occurrence of a specific combination of categories. Another mistake is not accounting for the total number of observations when calculating the joint relative frequency.
Additionally, avoid the mistake of confusing joint relative frequency with marginal relative frequency. Remember, joint relative frequency focuses on the occurrence of specific combinations, not just individual categories.
Can joint relative frequency be applied to more than two variables?
Joint relative frequency can technically be extended to more than two variables, but it becomes increasingly complex. For three or more variables, you might consider using more advanced techniques like log-linear models or multivariate analysis.