Determining degrees of freedom is a fundamental aspect of statistical analysis, impacting the calculation of critical values and ensuring the accuracy of your findings. Understanding this concept allows you to make more informed decisions and derive more reliable results from your data.
Key Insights
- Degrees of freedom (df) in statistics denote the number of values in the final calculation of a statistic that are free to vary.
- Correct calculation of df is crucial for statistical tests, including t-tests, ANOVA, and chi-square tests.
- A practical recommendation is to utilize software or online calculators to verify manual calculations of df.
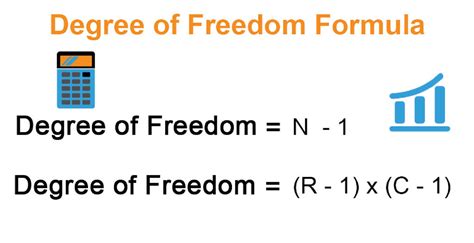
In the realm of statistics, degrees of freedom are pivotal because they inform the variability of data within a dataset. To better understand this, it is essential to grasp that df represents the number of independent pieces of information that go into the estimate of a parameter. For instance, when conducting a one-sample t-test, the degrees of freedom are calculated as n-1, where n is the sample size. This adjustment accounts for the estimation of the population mean from the sample itself, thereby reducing the variability that the sample data can provide.
Degrees of freedom become even more critical when performing more complex statistical tests, such as Analysis of Variance (ANOVA). In ANOVA, the degrees of freedom are divided into two components: the between-group degrees of freedom and the within-group degrees of freedom. The former is calculated as the number of groups minus one, while the latter is the total number of observations minus the number of groups. This division allows for the assessment of both the variation between groups and the variation within groups, leading to more precise conclusions about the dataset.
Moreover, the calculation of df is pivotal in the chi-square test for independence. Here, the degrees of freedom are determined by the formula (rows - 1) * (columns - 1). This calculation is fundamental in assessing whether there is a significant association between two categorical variables. Miscalculating the degrees of freedom in this scenario could lead to incorrect conclusions about the relationship between the variables being studied.
What happens if you incorrectly calculate degrees of freedom?
Incorrectly calculating degrees of freedom can lead to inaccurate p-values, thereby affecting the results of hypothesis tests. This misstep can cause either a Type I error (false positive) or a Type II error (false negative), compromising the validity of your statistical analysis.
Can software simplify the process of calculating degrees of freedom?
Absolutely. Statistical software packages such as R, SPSS, or Python libraries like SciPy provide built-in functions to simplify the calculation of degrees of freedom for various tests. This not only saves time but also reduces the margin for human error.
In summary, correctly determining degrees of freedom is a cornerstone of statistical analysis, influencing the outcome and accuracy of your results. Whether you’re conducting a simple t-test or a complex ANOVA, a solid grasp of this concept ensures your conclusions are both robust and reliable. Utilize software tools to aid in your calculations and, above all, ensure that your understanding of degrees of freedom is precise and unwavering.